Analytics & Reporting
2 min read
Looker Studio vs. Power BI vs. Tableau: A Comprehensive Comparison

Looker Studio
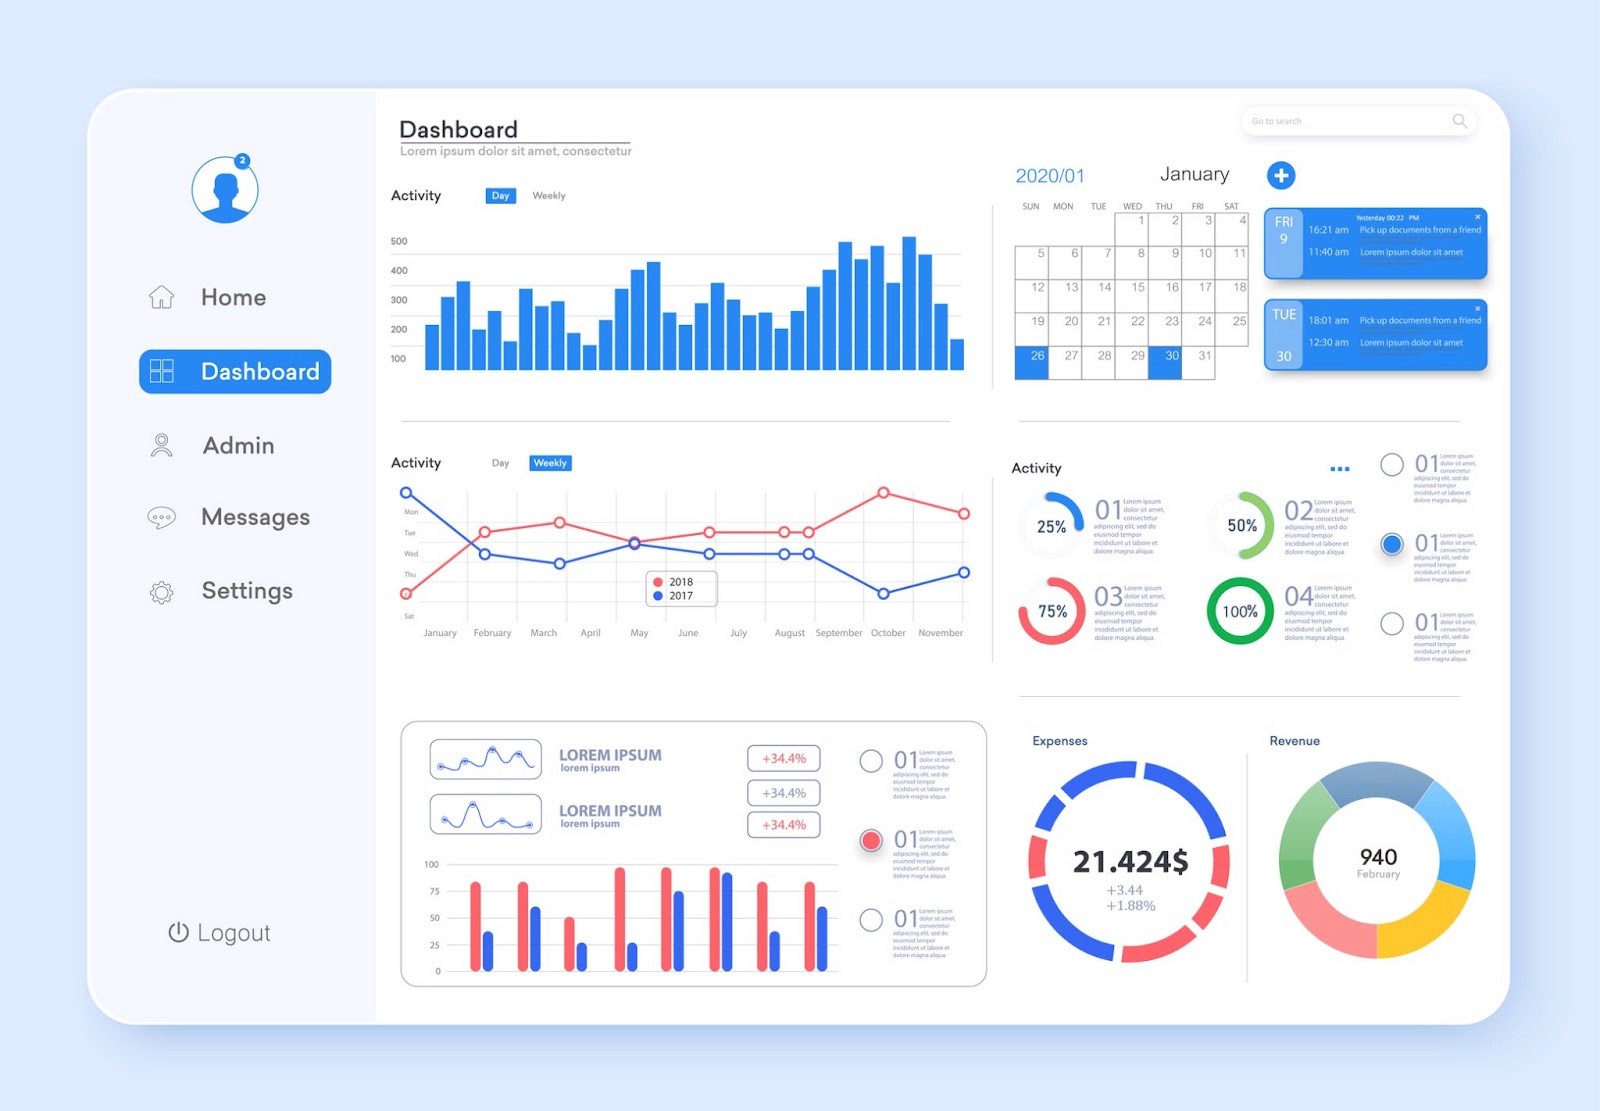
Originally launched as “Google Data Studio” in March 2016, it has since been rebranded to Looker Studio and become part of the Google Marketing platform. Looker Studio is a free data visualisation tool that integrates seamlessly with other Google services such as Google Analytics, Google Ads, and Google Sheets. It offers a user-friendly interface with its drag-and-drop capabilities, making it accessible for users with little to no coding experience. One of its standout features is its real-time data updating, which allows for dynamic and interactive reports. It also supports custom data connectors, enabling integration with databases and other third-party services. These 3rd party services allow for a wide range of platforms to be connected to Looker Studio. While it may lack some of the advanced analytical features found in other platforms, its ease of use and zero-cost barrier make it an excellent choice for small to medium-sized businesses or individual users.
Positives:
Feature | Description |
|---|---|
Integration | Seamless integration with Google Analytics, Google Ads, and other platforms. |
Customisation | Easy-to-use customisation options for dashboards and reports. |
Pricing | Free to use, making it accessible for small businesses. |
Collaboration | Super easy real-time collaboration with team members. |
Sharing | Simple sharing options through links and email. |
Embedding | Easily embeddable in websites and other applications. |
Regular Updates | The platform is updated regularly with new visualisations and features |
Easily Accessible | Can be used on any machine when logged in with Google Account |
Negatives:
Feature | Description |
|---|---|
Limited Advanced Features | As of now, it lacks some advanced analytics and visualisation that other tools may provide features. |
Data Refresh Rate | Slower data refresh rate compared to premium tools. |
Poor Phone Compatibility | Reports are hard to navigate on a mobile phone |
Power BI
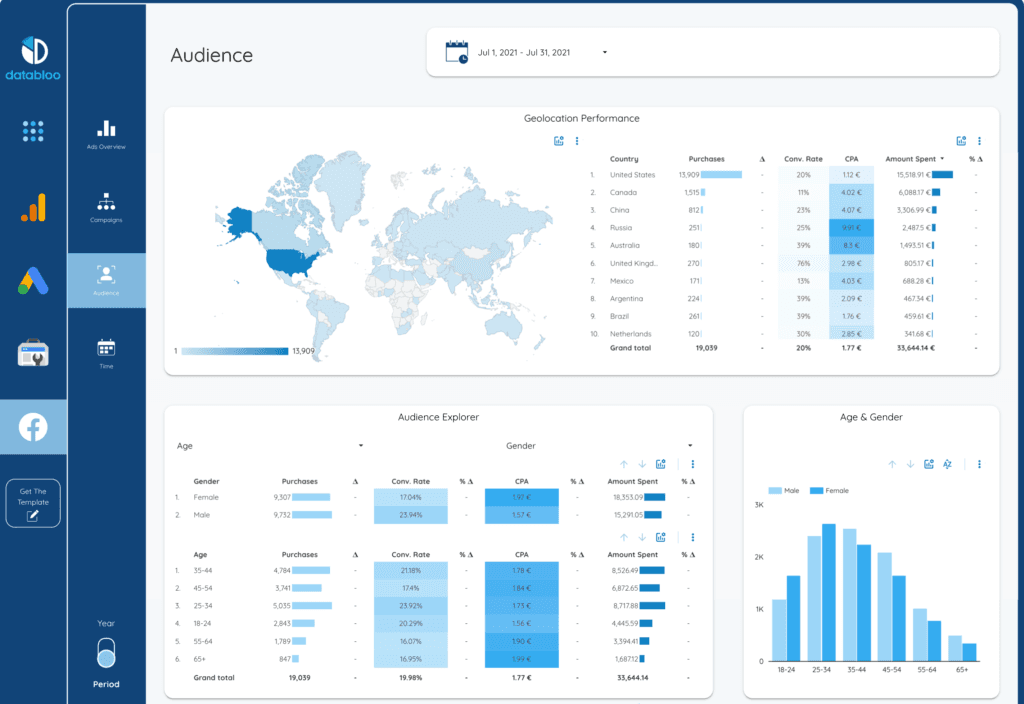
Power BI, unveiled by Microsoft in 2013, is a business analytics tool from Microsoft that offers data visualisation and business intelligence capabilities. It integrates well with Microsoft’s ecosystem, including Azure, Excel, and SQL Server, providing a unified experience. Power BI is known for its robust set of features like natural language queries, data shaping, and the ability to run complex data models. It offers both cloud-based and on-premises deployment options, catering to different business needs. The platform also supports a wide range of custom visualisations and advanced analytics through Power BI Desktop. While it offers a free version, the more advanced features require a paid subscription, making it a scalable solution for businesses of all sizes. Note that Power BI can only be used on a Microsoft operating system
Positives:
Feature | Description |
|---|---|
Advanced Analytics | Offers a wide range of advanced analytics and visualisation features. |
Integration | Integrates with various Microsoft products and other platforms. |
Scalability | Suitable for businesses of all sizes with various pricing plans. |
Sharing | Offers various sharing options, including publishing to the web. |
Negatives:
Feature | Description |
|---|---|
Learning Curve | Can be challenging for beginners due to its complex interface. |
Pricing | Can be expensive for small businesses, especially for premium features. |
Complex Collaboration & Sharing | More complex procedures need to be navigated in order to share and collaborate on dashboards |
Embedding | Embedding can be complex and may require technical expertise. |
Tableau
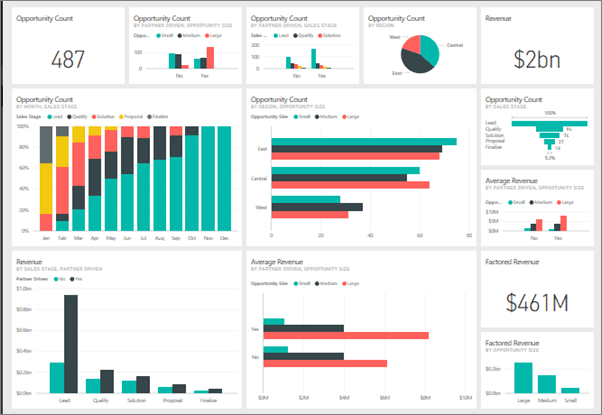
Tableau is a leading data visualisation tool that focuses on turning raw data into understandable insights through interactive and shareable dashboards. It offers a wide range of data connection options, from spreadsheets to cloud services and on-premises databases. Tableau is highly customizable and supports complex calculations, trend analysis, and statistical modelling, making it suitable for advanced analytics. It also offers Tableau Public, a free service that allows users to publish their visualisations publicly. However, the platform can be resource-intensive and may require a more powerful hardware setup. Its comprehensive package pricing is on the higher end, making it more suitable for medium to large enterprises. Tableau was first launched in 2003 by Tableau Software; but has since been acquired by Salesforce in 2019.
Positives:
Feature | Description |
|---|---|
Visualisation | Offers industry-leading data visualisation capabilities. |
Flexibility | Highly flexible in connecting to various data sources. |
Community | Strong community support and extensive training resources. |
Collaboration | Collaboration features available, including Tableau Online for team access. |
Embedding | Provides options for embedding in websites and other platforms. |
Negatives:
Feature | Description |
|---|---|
Pricing | Can be expensive, especially for small businesses. |
Complexity | Requires a steeper learning curve, especially for non-technical users. |
Sharing | More complex steps for sharing |
External Visualisations | No community visualisations |

Conclusion
While Power BI and Tableau offer robust features and capabilities, Looker Studio stands out as my preferred option. Its seamless integration, user-friendly interface, and free accessibility make it an ideal choice for businesses looking to start their data visualisation journey.
Looker Studio provides a perfect balance of customization and simplicity, allowing users to create insightful dashboards without the need for advanced technical skills. Its collaboration features and integration with other Google products make it a cohesive tool for data-driven decision-making.
Whether you’re a small business owner, an individual entrepreneur, or a data enthusiast, Looker Studio offers the flexibility and functionality to meet your unique needs. Explore more about Looker Studio and how it can elevate your data analysis by visiting https://dashworx.co.uk/
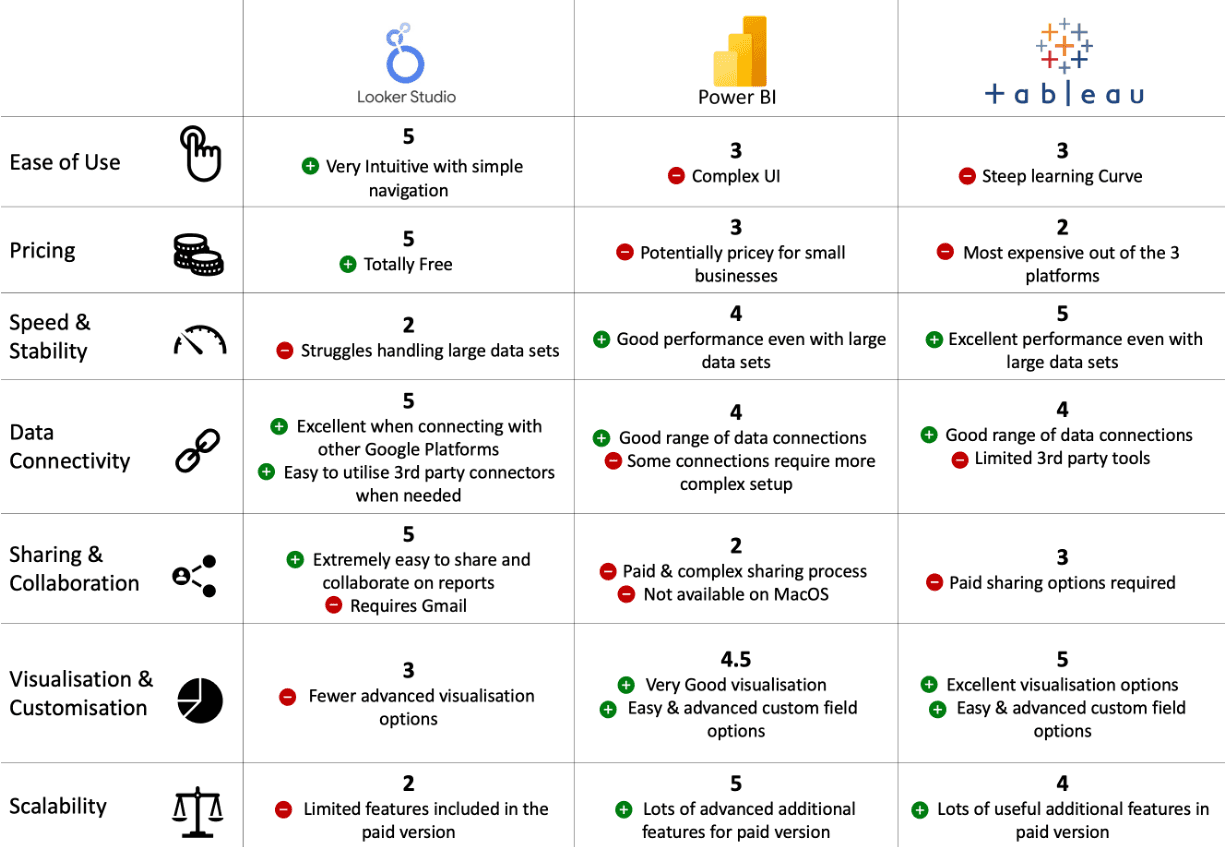
Looker Studio – 27
Power BI – 25.5
Tableau – 26
All articles
In the ever-evolving world of data visualisation, three tools (in my opinion) have emerged as industry leaders: Looker Studio, Power BI, and Tableau.
Written by
Dashworx
Published
See how Dashworx unifies your data and cuts reporting time.