Product updates

Changelog

New features, improvements and fixes across the Dashworx platform, newest first.

New

KPIs & Automation

Compare every KPI with the same period last year, pick any date range in a couple of clicks, and break a KPI down to see what’s driving it. Plus invite links and quicker user management.
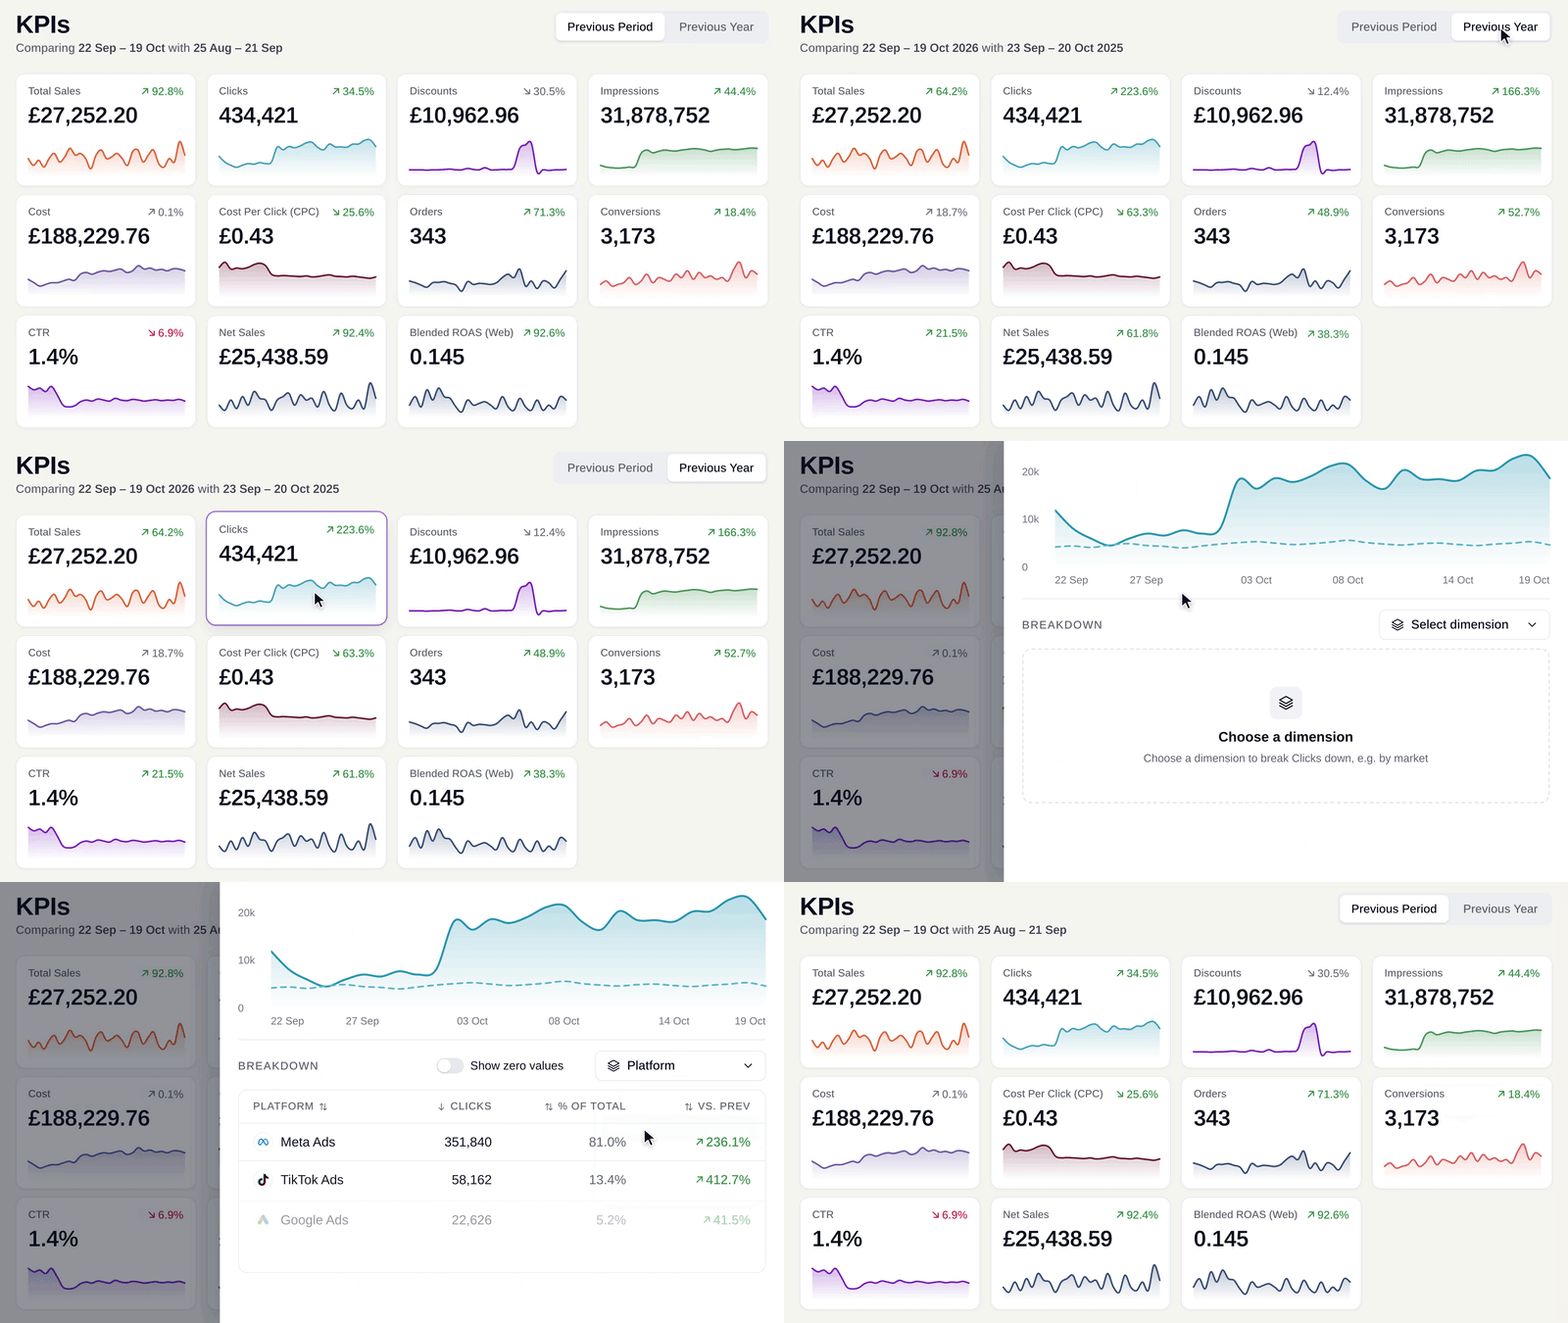
Compare with last year

Every KPI can now be compared with the same period last year as well as the previous period. KPI Pulses can be set to compare either way, so your scheduled updates show the comparison that matters to you.

A faster way to pick dates

A new date picker gives you quick presets, plus a calendar for any range up to a year. It only offers dates that have data, and the range you choose stays in the link, so you can share exactly what you’re looking at.

See what’s driving a KPI

KPI breakdowns split a KPI by a dimension, such as platform, market or campaign, so you can see which parts are moving the number.

Invite links

Admins can share a single link that lets people join with set dashboard and group access, and revoke it at any time. Links are managed from User management.

Find people faster

User management now has search by name or email, plus a filter to show invites only.

More accessible, more polished

Badges and alerts meet colour-contrast standards, screen readers announce notifications, and dropdowns, charts and dashboard date ranges have all been refined.

New

Integrations

StackAdapt metrics are now available in Dashworx, alongside new metrics for platforms you already connect.

You can now build KPIs on StackAdapt performance next to the rest of your marketing data. We’ve also added new metrics for several of the platforms already connected to Dashworx, so there’s more to track without any extra setup.

New

Platform

Group Switcher brings every brand, client and portfolio into one place, and KPIs and KPI Pulse are now available to agency and multi-brand accounts.

Group Switcher

This release is built for agencies and multi-brand teams. Group Switcher lets you move between every brand, client and portfolio from one place, with Smart AI and Visual Intelligence available wherever you switch. It gives your whole team one source of truth, clearer data access and faster decisions.

KPIs and KPI Pulse for agencies and multi-brands

KPIs and KPI Pulse are now available to agency and multi-brand accounts for the first time. Track the metrics that matter for every brand at a glance, then automate KPI Pulses to yourself, your team or your clients on a schedule you choose.

A revamped metric registry

Metric registry revamped and updated enabling KPIs and KPI pulse for clients with custom data pipeline setups and warehouses such as Snowflake, BigQuery, Azure, Amazon S3 and Databricks.

New

KPIs & Automation

KPI Pulse is officially released: automate your key metrics to your own inbox or your team’s, on the cadence you set.

KPI Pulse is now officially released. Automate your KPIs straight to your own inbox, your team’s inbox, or both.

Set up in two clicks

Choose the metrics you want to automate and who you’d like to send them to.

Choose your time and cadence

Send a Pulse daily, weekly or monthly, at a time that suits you, with each metric compared against the previous period or the previous year.

Improved

KPIs & Automation

Dashworx now recognises your data columns even when they’re named differently, and long drop-down menus scroll smoothly.

Your columns, recognised

Metrics now match the columns in your data even when their names are written slightly differently. A column we don’t yet have a definition for still picks up the right platform and icon, with a cleaner label.

Up-to-date definitions

We refreshed our metric library from our data team’s latest definitions, and every metric now carries a priority.

Smoother menus

Long drop-down menus now scroll smoothly within their panel, so every option is easy to reach.

Improved

KPIs & Automation

KPIs now compare against the same period last year, show exact values on hover and follow your own timezone, and the app has a cleaner, rebuilt sidebar.

Compare with last year

Alongside the previous-period comparison, each KPI now shows how it performed in the same period last year, so seasonal swings are easier to read.

Leave out today

A new ‘Include today’ option lets you leave a part-finished day out of your date range, so your comparisons always reflect complete days.

See the exact number

Hover over any KPI chart to see the value for that day. Charts also show negative values clearly, with the scale adjusting either side of zero.

Your timezone, your day

KPI date ranges follow your account’s timezone, so the start and end of each day line up with your working day.

A bigger metric library

KPIs now draw on a library of more than 780 metrics across 16 platforms, each marked with its platform’s icon.

A cleaner app

The sidebar has been rebuilt, with a better mobile menu, scrollable menus, and notifications that always appear in front of open windows.

New

Platform

AI chat now keeps your conversation history, guardrails can be edited in the platform, and clients can see a breakdown of their credit usage.

Conversational history in AI chat

Conversations with Dashworx AI now keep their history, so you can pick up an earlier chat right where you left off.

Guardrail editing for the data team

Our data team can now edit guardrails directly within the platform, so changes to how functionality behaves can be made quickly.

Credit pricing breakdown

Clients can now see a breakdown of their credit pricing, making it clear how their usage adds up.

Improved

Conversational AI

Give new teammates the right data agents from their invite, and let AI answers keep running while you get on with other work.

Access from day one

When you invite someone to Dashworx, you can now assign their data agents at the same time as their dashboards, so they can start asking questions as soon as they join.

Keep working while AI answers

Close the chat panel and your answer keeps coming. A marker on the dashboards page shows when one is still in progress.

Cleaner answers

Tables in AI answers are labelled and formatted more accurately, making answers quicker to read.

New

Conversational AI

Dashworx AI can now suggest your next question after each answer, and you can see your AI usage from the Analytics page.

Know what to ask next

After each answer, chat can propose follow-up questions that dig further into your data. It can be switched on or off for your account.

See your usage

A usage summary on the Analytics page shows how much of your AI allowance you’ve used and when it resets.

Small touches

Cancelling an answer now puts your question back in the prompt so you can tweak it and resend, tables show full numbers rather than shortened ones, and the Dashworx icon adapts to light and dark browser themes.

Improved

Conversational AI

AI answers can now show images, you can stop a response part-way through, and Dashworx has a fresh new icon.

Images in answers

Images included in an AI answer now display right inside the chat.

Stop a response

A new cancel button stops an answer mid-way, which is handy when you want to refine your question.

Clearer status messages

Chat keeps you informed with clear status messages, including when you’ve reached your message limit.

A new look

The new Dashworx icon now appears across the app and in your browser tab.